Jew In The City? Population and Responsa

Many of our readers are probably familiar with JewishGen, the premier resource for Jewish genealogical research. For quite some time, we’ve had our eye on their Communities Database, which contains information on the history, names, coordinates, environs, and population for Jewish communities in Europe, North Africa, and the Middle East. We have often used it to help us identify places, which involves a lot of guesswork since their search engine only allows Latin characters without diacritics.

You may have noticed the JewishGen logo to the right. We put that there because we recently met with the good folks at JG, and we agreed to all help each other out by sharing data and resources with each other and with the public.1Be advised: Moshe will happily go the full NASCAR for datasets.

What does this mean? It means new and better toys. For instance, that thing about not being able to search for places by Hebrew characters? Well check out our searchable map of Hebrew place names:

As of now, this table has a bit under 4000 place name variants in Hebrew characters. Once we complete the merge of our list with JG’s list, that number will more than double. And we have also started merging these lists with Berl Kagan’s Sefer Prenumeranten. Play around with it. There’s nothing like it, and this is just an “alpha” version.

It also means that Moshe got to play around with the population data in the Communities Database. We have wondered for some time whether there is any relationship between the population of a community and the number of responsa sent there. 

So is there a relationship? The short answer: It’s complicated.

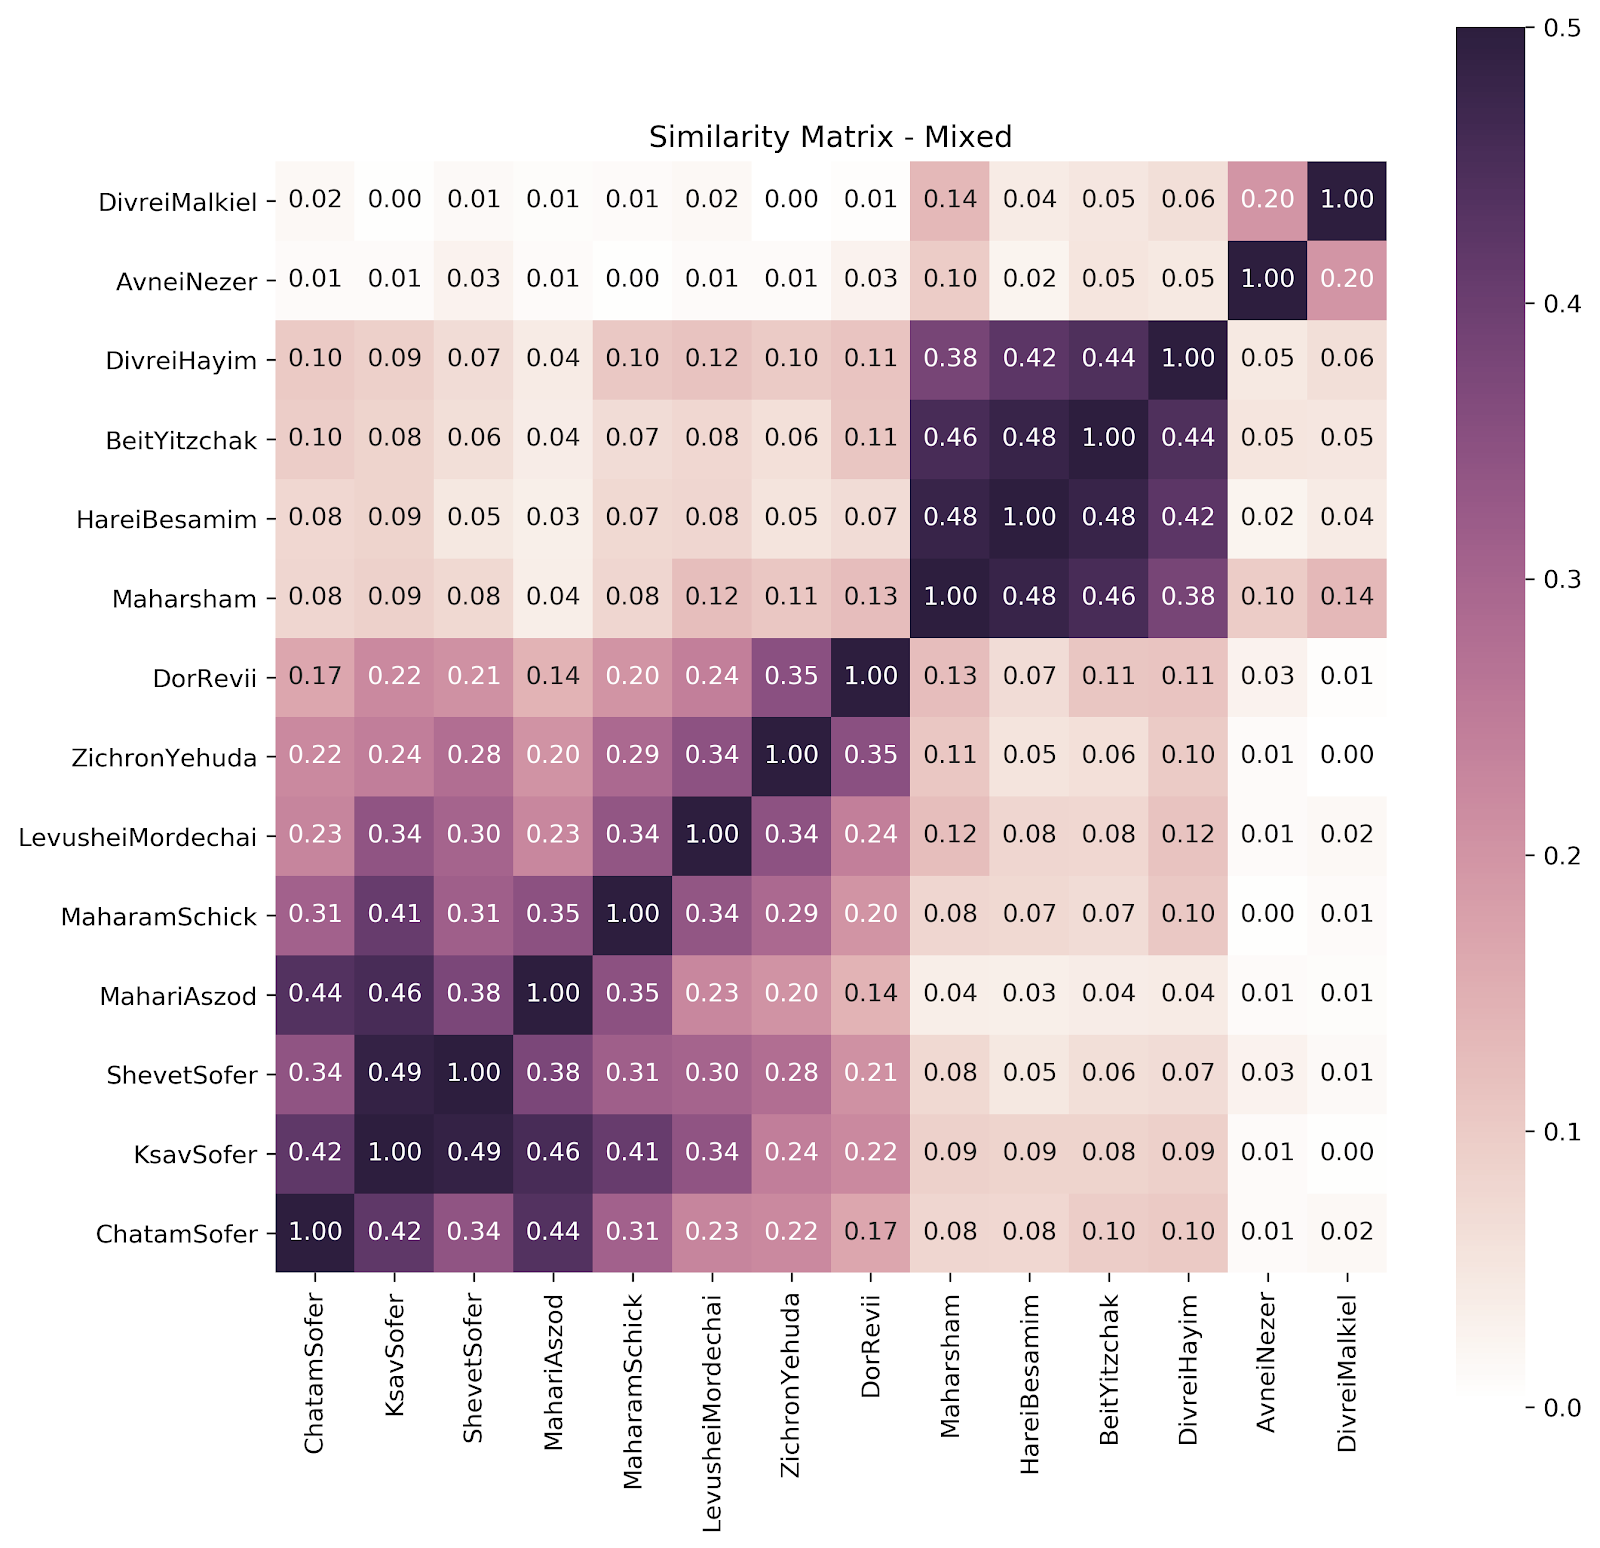
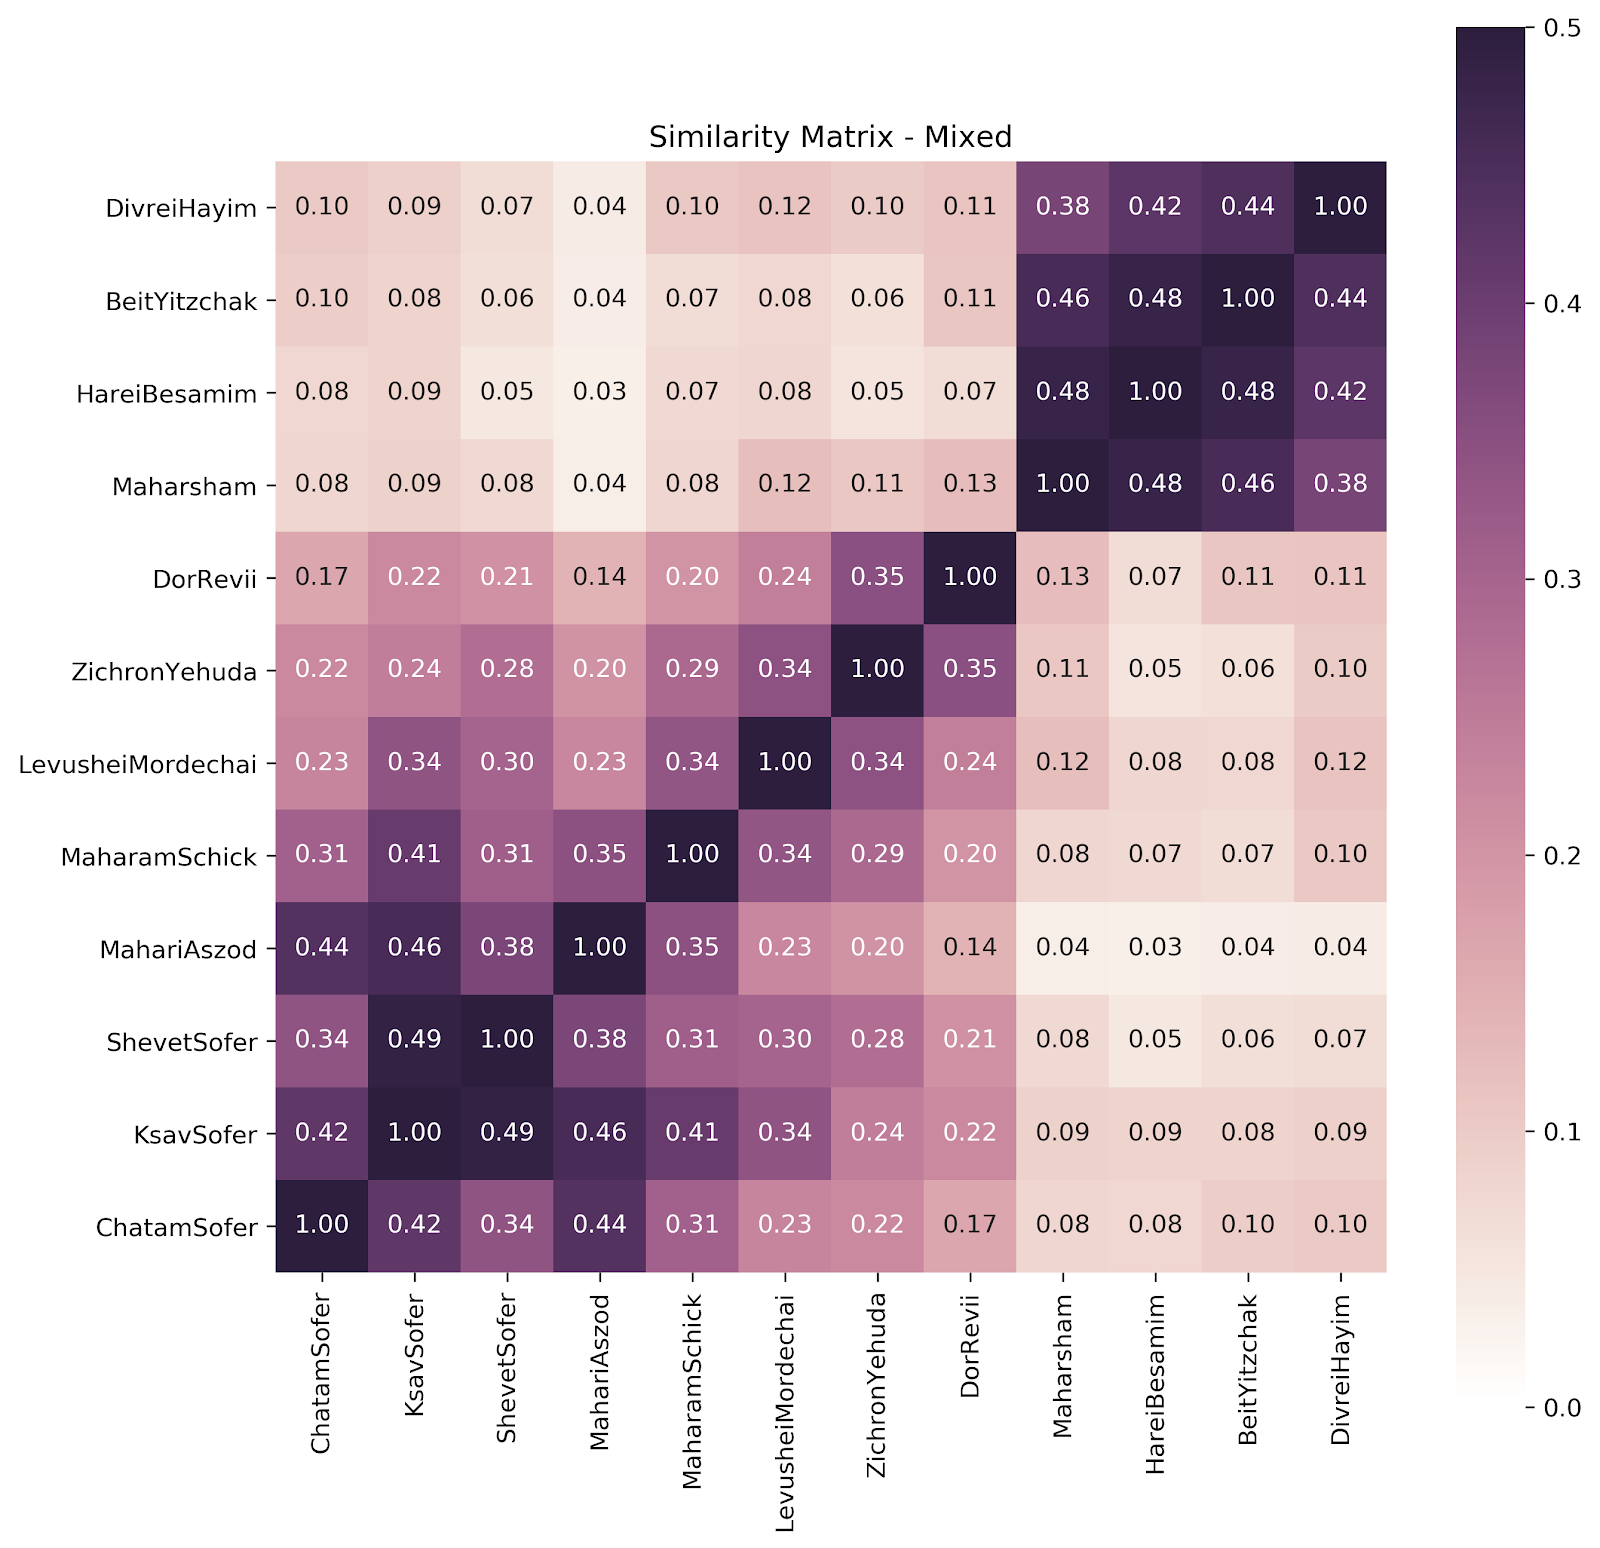
Let’s compare some of our favorites (a note: we used 1900 for availability reasons, surprisingly, there’s not a strong penalty for correlation when using earlier poskim). We’ve dropped communities with over 20,000 Jews from the graph, and also because there might be other effects going on over there.2I have a very strong suspicion that this is subject to a major prewar / postwar gap.

If this reads as a horrible mess to you, then you’ve read it correctly. This is the picture of statistical noise. 

[We’re going to use a lot of numbers here, so for those who aren’t into mathy stuff, here’s the baalebatish version: A perfect positive correlation between number of responsa and population would mean that the bigger the city, the more responsa, no exceptions. It would have a score of 1. If it had a perfect relationship but it wasn’t a straight line, its Pearson correlation coefficient would be a bit lower while Spearman would remain at 1. A perfect negative correlation would mean that the bigger the city, the fewer responsa (or the more responsa, the smaller the city), no exceptions. It would have a score of -1 (again, with Pearson being lower if it isn’t linear). A score of zero means that there’s no correlation at all. With this, the numbers that express the correlation should be basically intelligible and always between -1 and 1.]

The strongest individual correlation here is Mahari Aszod at a whopping R=0.175, and he’s not even near contemporaneous. Among the poskim who were active around then, we have Avnei Nezer at R=0.04, Beit Yitzchak at R=0.11, Divrei Malkiel at R=-0.04(!), and leading the pack, Levushei Mordechai at R=0.14 (Pearson). Using Spearman it teases out a little higher, but still nothing awe-inspiring.

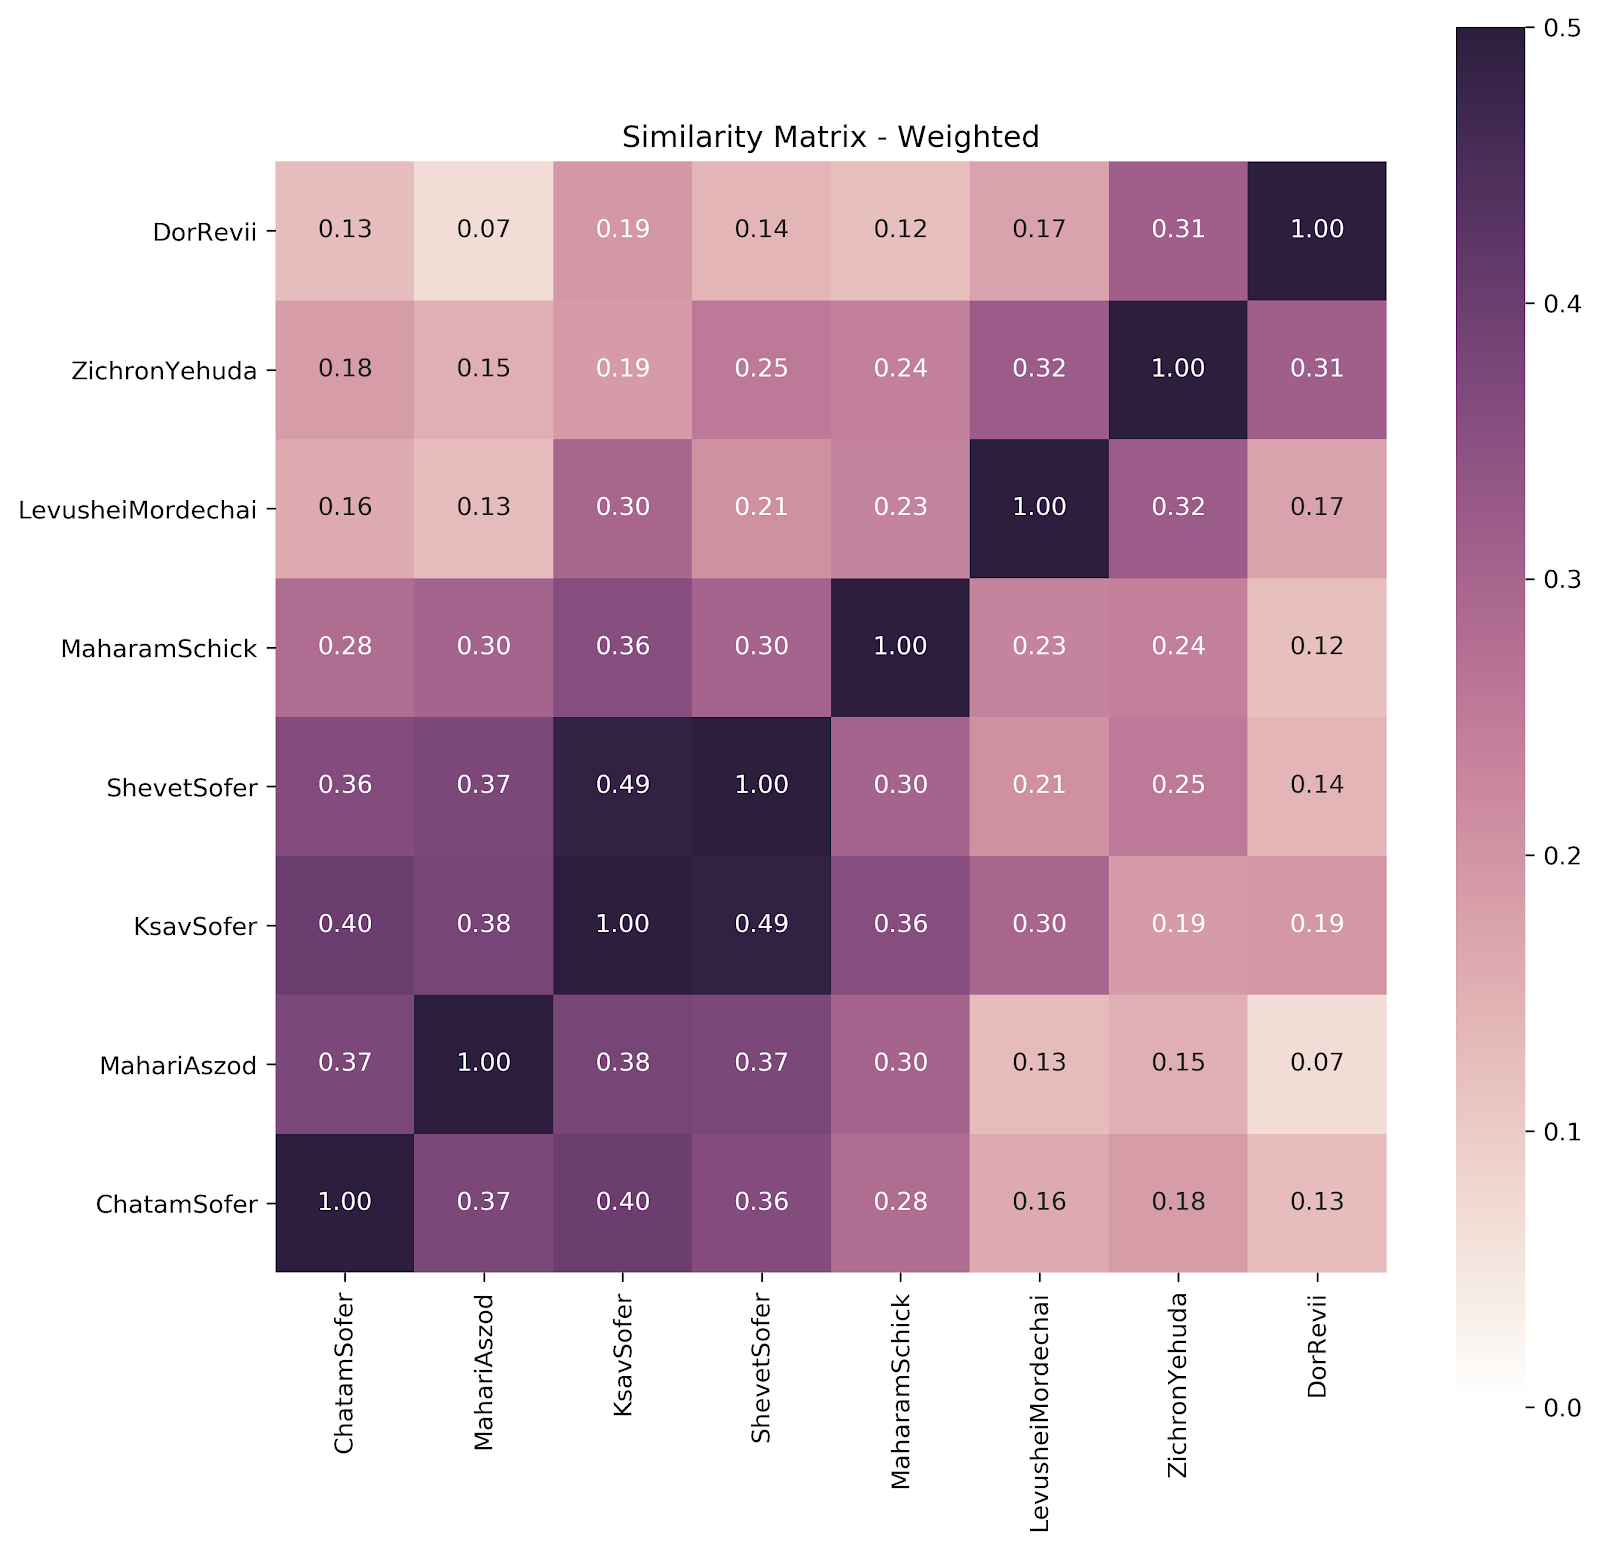
Let’s keep going: what happens when we sum the place counts together?

As evidenced by the trendline (or the eye test), it’s pretty grim.

Even just looking at the count of books we have, it doesn’t really get better. Regardless of whether you use Pearson, Kendall3For the not mathematically inclined: yeah, you can forget about Kendall, don’t bother., or Spearman, R<0.1.4I thought of using more, but I’m scared of P-hacking it by throwing more metrics at it.

I don’t really know quite what to make of it. The main thing I suspect: as a place becomes bigger and more independent, it needs to ask fewer questions (i.e., larger towns “clear the neighborhood”), offsetting the increase in populations (or at least roughly). In that case, there would be a population “sweet spot” in which a town is big enough that it generates lots of questions but not so big that local talent can handle them adequately. And then we might see something like the curve we get if we wildly overfit a trendline:

This remains an open question for me, but I still wanted to publish this. Let me explain myself. Firstly, given the amount of noise here, it’ll take a long time for us to fully clarify the issue.

Elli asked me the following questions when I showed him the draft, and I think they’re interesting:

  1. Maybe we should simply disregard towns that were known to have rabbis who wrote responsa, and then look at the rest?
  2. There’s a “nudnik effect”: Like Levushei Mordechai to his son-in-law in Galante.
  3. Or maybe it’s not about cities at all, but about people. The carryover we saw in Hungary – maybe it was really carryover of individuals, not cities. 

With regards to (1), well, it wouldn’t bump off enough places to make a dent, and you’d probably just drop it even further. As for (2-3), well, it’s actually all the more striking. These are both very real effects (look for Yaavetz’s over the top disses of some of his questioners(!) in She’elat Yaavetz), but strangely, even this doesn’t bear some obvious statistical linkage to population. These are all real questions, and it’s really very possible the answer could change with more data, but given the data we have at the moment, it’s clear we’d need a lot more data to truly get clarity on this issue.

So why discuss this at all? Well, one of the scourges of modern science is ‘P-Hacking’. To quote Wikipedia: “[P-hacking] is the misuse of data analysis to find patterns in data that can be presented as statistically significant, thus dramatically increasing and understating the risk of false positives. This is done by performing many statistical tests on the data and only reporting those that come back with significant results.”

For a simple example, if we look at statistically significant as being P < 0.05 (less than a 5% probability of occurring by random chance), well, if we look at 50 different foods in a diet study, we’ve now got over a 90% chance of finding something ‘statistically significant’ by random chance alone.5This is not a random example, those articles about diet studies showing ‘kale causes cancer’ or whatever are almost always p-hacking.

We’ve published stuff with attempts at very concrete findings — take our post on the handover of rabbinic leadership in Hungary, for example. Honesty dictates that we also on occasion say: ‘it’s hard to see a signal in the noise here’, even if you can’t get a journal to publish ‘nothing much to see here, folks’.


I wanted to title this post “Baby Keep It Real With His People”, referencing the hit song ‘Baby‘ by Lil’ Baby (feat. DaBaby). Sadly, despite my best efforts, the number of fans of both responsa and Atlanta hip-hop remains small, so it went. Suffice it to say, in both data and rap, HaMapah supports Quality Control.

Measuring the Geographic Similarity of Poskim*

There’s a phrase that people like to quote, “labels are for cans”. While the statement’s intentions — either “stereotyping is bad” or “I’m a special snowflake”–are good and relatively inoffensive, respectively, it makes for bad epistemology. It’s a terrible approach to organizing information.

To understand, we need to generalize. To understand the course of any field, we need a broader understanding, a concept of a movement or a style. Sometimes, this division can take on an objective aspect. At an extreme, an artistic group like the Pre-Raphaelite Brotherhood or the Wu-Tang Clan has a defined set of artists who comprise it. However, even that can quickly break down. Ford Madox Brown is stylistically part of the Pre-Raphaelite Brotherhood, he hung out with them a lot, and his work is displayed with theirs, but he was never a member. Broader characteristics run into issues like this too. Kanye West may be from the Midwest, but to the accepted meaning of a “Midwest Rap” style, as exemplified by Twista, Tech N9ne, Krizz Kaliko, Royce Da 5’9”, or Eminem, an emphasis on technical mastery, speed, and precision, with a smattering of themes from horrorcore, he’s certainly not that.

So when I try and discuss data-informed categorization, it’s important to clear up my intent up front. In terms of intellectual categories, I’m not trying to remove subjective judgements. I’m trying to inform. The goal here is to present another variable that can be incorporated into a broader stylistic judgement. The actual measured effect of a posek in terms of area of direct influence, implied or otherwise, should certainly factor into any intellectual taxonomy, and certainly ought to dominate a taxonomy of the landscape.

Our maps have their limits. When we have areas of influence that are completely disjunct, it’s trivial to draw the appropriate conclusions with the eyeball test. However, what to do with somewhat overlapping sets of a couple hundred points each? How do we meaningfully assess the relative similarities of multiple sets of a few hundred points of different sizes, all weaving in and out of each other?That’s where the math comes in.

Our basic metric is cosine similarity. For readers who don’t remember much about sines and cosines, here’s a little refresher. The cosine of 0 is 1, and the cosine of 90 degrees is 0. The more acute an angle, the closer it gets to 1.

Now, let’s imagine two poskim. Posek A writes responsa only to Minsk, and Posek B writes responsa only to Pinsk. Imagine that we plot this on a two-dimensional grid, with the X-axis representing responsa to Minsk, and the Y-axis representing responsa to Pinsk. Each posek can then be expressed as a point in the grid: Posek A as (M, 0) and Posek B as (0, P), because Posek A writes 0 responsa to Pinsk, and Posek B writes 0 to Minsk. That is, Posek A is expressed as a point on the Minsk axis, and Posek B as a point on the Pinsk axis. We can then think of our poskim as line segments, or “vectors”, from the origin to the grid coordinate. It’s obvious that the two vectors in our case are orthogonal. They form a right angle, and thus have a cosine of 0. This means that they are perfectly dissimilar; they have no places in common.

Now imagine Posek C who also writes only to Minsk. Her vector will form an angle of 0 degrees with Posek A’s vector, so they will have a similarity score of 1, which is the cosine of 0.

This exercise is meant to show how the cosine of two vectors provides a good metric for scoring similarity. It’s not perfect, but it’s good.

Two dimensional space is pretty easy to envision, but dealing with 500 place names requires a 500-dimensional vector space, which is impossible to envision. Fortunately, thanks to math, we don’t need to envision it. And since there cannot be any negative numbers (because it’s impossible to send a subzero number of responsa to a place), the angle between the vectors will always be between 0 and 90. We can compare any two poskim to obtain a similarity score between 0 and 1.

Let’s walk through the basic process again with vectors in 4 dimensions. We start with the data from two poskim.

So this table will become two vectors, for Posek D [7 4 7 1] and for Posek E [3 0 9 2]. The order of the cities doesn’t matter, provided that they are respective — that the nth place in each refers to the same place. We then take the angle between the two vectors. In this case, the angle is about 34.2 degrees, and the cosine of the angle is 0.827.[1] Since the cosine goes from 0 to 1, the similarity between the poskim is high. This passes the eyeball test, too; there is no city to which E writes that D does not write to, and only one that D writes to but not E. This is a lot more similar than we’d expect in reality. As we have seen, the career of a posek is dynamic; they move, and their sphere of authority grows and shrinks and shifts over time, and communities likewise change. When we divide a posek’s career in half chronologically[2] and compare the first half to the second, the cosine tends to be in about the 0.35-0.5 range (typically around 0.4). Therefore, when two poskim score 0.3 or above, it means they are very similar in terms of geographical reach. A score above 0.4 means that the geographic reach of the two poskim are as similar as two halves of the career of a single posek, or about as similar as can reasonably be expected.

We can formulate another version of this, where we turn the vectors into binary vectors — D now gets [1 1 1 1] and E [1 0 1 1], the effect here being to just ask about where, without regard to distribution. We call this “unweighted”. We use a third type here — “mixed” — a simple average of the two. Crucially, the size of the vector — the distance from the origin — doesn’t impact the angle, so we can measure between people with very different corpus sizes.

What can we get from this? For starters, can we justify traditional divisions? Let’s take a look.

We can see a pretty clear division here — with Hungarians and Galicianers following the expected division, and a showing for our Poles (Avnei Nezer and Divrei Malkiel) of “close but no cigar”. (Divrei Malkiel was the Rav of Łomża, close to Lithuania; some may protest his being lumped with the Poles.) Let’s drop them for now.

So we see a really clear division between the Hungarian and the Galicianers. The Galicianers are all quite similar to each other, and all mostly dissimilar to the Hungarians. But there’s another thing going here too. Let’s take a look at just the Hungarians. And we’ll rearrange it here.

We can tease out a couple more things here. We can see the Sofer family — Oberland cluster clearly; the Maharam Schick (who moved from Oberland to Unterland mid-career);belongs there too, but a little less; the two most Unterland Unterlanders pair nicely, and the Levushei Mordechai (who also moved) straddles the two.

Further data would be nice (and we’re working on it), but what we have thus far suggests that we can view Hungarians as a distinct species, as it were, with Unterland and Oberland subspecies (and those who straddle both).

I’ll add another point — preliminary results thus far delineate that Hasidic psak is a subgroup within regions. Hasidic poskim do not command broad loyalty beyond their region. This may also well be the case beyond just the geographical spread data, in terms of methodology and style as well; for one example that comes to mind immediately, we hypothesize that Chabad’s tendency to rule strictly about eruvin is linked with their being a Hasidic subset of Lithuanians, not a Lithuanian subset of Hasidim.

[*] Thank you to R. Dan Margulies, who hashed out the math here with me (Moshe).

[1] In reality, we don’t ever take the actual angle, we calculate it as dot(u,v)/(norm(u)*norm(v)).

[2] Meaningful divisions here are less similar than random divisions. People die, people move, and various other events mean that we see a grouping that is “lumpy” — dividing a corpus chronologically does not approximate an even division. In a random division, any discrepancy between the similarity and 1 would be pure noise. Here, there are signals going on too.

Mountains of Spices

We haven’t been posting, but we’ve been busy. We have updated some of the earlier maps with improved data and better identifications. We also have some shiny new toys to share.

First up is Harei Besamim, by Rabbi Aryeh Leib Horowitz (1847-1909), a contemporary and “competitor” of Maharsham in Galicia. During his career, he served terms as the rabbi of Seret, Stryi, and Stanislav (I’ll take “Galician Cities that Start with ‘S’” for $500, Alex). (Yes, we are aware that Seret is in Bukovina, that Stanislav is now called Ivano-Frankivsk, and that he was also the rabbi of Zaliztsi early in his career.)

We have a map (click here) and a plot by year. The plot by year is fairly unremarkable; it’s in line with most of what we’ve seen before, a rise in his earlier career followed by a plateau, with a typically high degree of noise.

Responsa by year

He is not very well-known today; he doesn’t even have a Wikipedia page. But he wrote over 600 responsa, to over 200 communities. His correspondents included major rabbinic and Hasidic figures. And he also provides some excellent contrast data to Maharsham. We haven’t formulated any hypotheses about what this means, but the data is good, and our mission is to provide good data. As for an explanation, tzarich iyun, or rather, tzarich data. Maybe once we map Beit Yitzchak and Sho’el U-meshiv, or digitize the census of Galicia from 1900, things will be clearer.

Look out for Moshe’s upcoming post on the Seforim Blog (Sunday) on whether data analysis can tell us whether the late volumes of Igrot Moshe are forgeries.

The Hungarian Succession

One of the questions that we think HaMapah can help answer is the dynamics of succession. When a posek dies or is otherwise incapacitated, who picks up the slack? Does it diffuse among multiple poskim or is there an heir apparent?

It is safe to say that we will see different patterns emerge as the project continues, but today we are going to look at a fairly elegant series of successions in Hungary during the latter half of the nineteenth century. Hatam Sofer, the subject of several posts thus far, was, by the time he passed away in late 1839, the leading posek in Hungary. Three poskim who served the same territory after his passing were Rabbi Yehudah (or Mahari) Aszod (1794-1866), author of Shu”t Yehudah Ya’aleh; Rabbi Avraham Shmuel Binyamin Sofer (1815-1871), the son of Hatam Sofer and author of Shu”t Ketav Sofer; and Rabbi Moshe Schick, author of Shu”t Maharam Schick (1807-1879).

Let’s look at a map of the responsa of these four poskim (including Hatam Sofer). As always, opening separately and using the selectors is recommended (but today more so than usual).

The similarity of each posek’s map to the others is remarkable, and we will come back to this.

Now let’s look at the dates of the responsa. The data contained in Mahari Aszod’s responsa is somewhat sparse, but we have dates for a good proportion of responsa by Ketav Sofer and Maharam Schick.

It should be noted that nothing is proven, and that the picture that we see is conjectural, and our roles but the pattern seems pretty clear: There is a “passing of the mantle” from Mahari Aszod to Ketav Sofer to Maharam Schick. Ketav Sofer, it seems, does not become the leading posek in Hungary until Mahari Aszod’s death (and subsequent portrait!) in 1866. When Ketav Sofer’s health began to decline, Maharam Schick took his place as the leading Hungarian posek. It is actually quite amazing to see how many of Maharam Schick’s responsa were penned in the last decade of his life.

The portrait in question

Returning to the similarity of the maps, Moshe has developed tools that will quantify the geographical similarity of the spheres of authority of any two poskim. This will be very useful for tracing things like succession, demarcating cultural boundaries, and demonstrating reach. We will devote a separate post to these. For now, it suffices to say that the geographic similarity of these four poskim is high enough that our categorization of them as “Hungarian poskim” holds water.[1]

[1] Simply put, we create a vector of the number of responsa to each city for each posek, and then take the cosine of the angle between them. Alternatively, we’ll take that vector and map to a binary vector, again, with each city its own dimension, and then take the angle between those two.  We generally use an averaged version of the two methods.

World Cup Edition

In honor of the World Cup we thought we’d post a bit on responsa to France and Croatia.

Let’s start with France.

Though it lies outside our main focus (for now), at the beginning of this project we mapped Dr. Pinchas Roth’s data set for the responsa of Rabbi Isaac of Dampierre, or Ri HaZaqen. Dr. Roth has been thinking about mapping responsa for some time now, and has been a supporter of HaMapah from the beginning. He and Prof. Rami Reiner, another friend of HaMapah, are preparing a critical edition of Ri HaZaqen’s responsa.

The methodology here is slightly different, focusing not on explicit addresses but rather mentions:

The pattern is interesting. There’s a clear view of the Tosafist heartland, if you will, in Northern France. And then, remarkably given the era and vastly inferior communications, there are relevant areas quite far from Ramerupt, Troyes, and Dampierre. The distribution is not smaller than 19th century poskim, though the volume is. The enormous advancements in communications will get many more people within the bounds of your cultural sphere to ask you questions, but they didn’t make the sphere bigger.

France’s role in the history of halakhah is well known, of course, but we can still have some love for Croatia. In the sixteenth and seventeenth centuries, the city of Ragusa, today’s Dubrovnik, was a major financial hub. More than a hundred responsa from Ottoman poskim like R. Shmuel de Medina and R. David HaCohen mention Ragusa or are addressed to it.

Perhaps the most important posek to reside in Croatia was R. David Pardo (1719-1792), author of Mikhtam Le-David, who served in the rabbinate in Spalatro. Among his responsa, in Even HaEzer 9, he addresses how the name of the city would be written in a get. The contemporary name for this city is Split, but Rabbi Pardo, sadly, doesn’t add “דמתקריא Splitsville”.

The Republic of Venice in the mid-18th Century. Note their control of the Dalmatian Coast.

A recurring pattern of note is the cities mentioned–the most prominently featured are Ragusa and Sarajevo. Modern Croatia, a pretty artificial construction, is split; the lower handle of the pliers, if you will, along the Dalmatian coast, on the Adriatic Sea falls into the Venetian, Greek, and Ottoman orbits, and most of the responsa from there are to Saloniki or Venice (R. Pardo was Venetian himself), and often dealing with travelers to and from Sarajevo, placing Split and Ragusa squarely within the context of traditional Balkan Jewry. However, from the northern handle of the pliers, we see responsa from Hatam Sofer to Osijek and Darda, giving us a rough lay of the land and the border between cultural appendages of Hungary and Balkan/Sephardic Jewry.

Among other notable responsa, are Maharshakh 1:138 and Maharashdam Hoshen Mishpat 438, which see the same case–nearly verbatim! A blatant case of historical posek-shopping!

At the end of day, though, much like on the pitch, Croatia can’t quite measure up to France. But a better run than you might have expected.

Signal and Noise: Part I

[Note: Sorry for taking so long. Elli wrote the following post. We were going to post this earlier, but several long and fruitful arguments about signal and noise delayed it, and brought it to the point where it was best split up for size. We have more material ready on this, and we should be able to get back to posting more frequently. Enjoy. –Moshe]

We have given a lot of attention to the “shape” of rabbinic careers over time. Specifically, we have looked at R. Yaakov Ettlinger and R. Moshe Feinstein and tried to consider what may have affected the shape. Factors like R. Ettlinger’s editorship of Der Treue Zionswächter and R. Feinstein’s presence in the Soviet Union during the years of Stalin’s religious purges, as well as his writing and publishing spike in the late 1950s and early 1960s, we argued, can help explain and understand how their careers developed and how they related to their own writings.

More broadly speaking, however, the goal of HaMapah is not to explain these phenomena as much as it is to show that they exist. Let us illustrate this with a table that shows the number of published responsa written by Hatam Sofer by year.

[Note: the data here is based on Hebrew year – 3760, not the actual Gregorian year. Our date parsing tools are accurate to the day where possible, however, choosing where to assign dates with year only and no further data to the Gregorian year is a bit of a question and a possible noise source].
Another map shows where the responsa were written to (for those with both dates and addresses) during those years. (ideally, open it in a new tab)

What we see here is very uneven. There is a general upward trend from the turn of the nineteenth century until the end of his life, but there is lots of variance from year to year. Before we ask how to account for that, we must ask what exactly needs to be accounted for. We should expect a certain degree of variance from year to year simply because that’s how life works. But what should we expect?

Let us discuss baseball for a moment. Unlike most other sports, much of baseball can be broken down into isolated events: pitcher versus batter. The outcome of any individual event is wildly uncertain, but over time patterns emerge. Certain features of a batter’s performance–the rate at which he strikes out, the rate at which he walks, the rate at which balls put in play result in hits–stabilize over time. There are also local environmental factors that come into play. Smaller parks tend to inflate offense and depress defense, while roomier parks have the opposite effect. Factors like wind, humidity, temperature, and altitude also affect performance. Strength of opponent is, of course, a significant factor. And, of course, there are factors in the personal lives of the players that can have an effect (usually detrimental): injury, illness, exhaustion, and grief, to name a few.

And then there is also simple, blind luck. There is only so much control that a batter can have over a ball hurtling toward him at speeds approaching (or exceeding) 100 miles per hour. Sometimes a well-struck ball finds the glove of a well-positioned fielder. Sometimes the weakest contact results in a base hit. That’s the way the ball bounces.

A basic idea of advanced statistical analysis is to try and isolate the relevant factors, the “underlying” performance of a player, that will give a better picture of who the player really is. It allows us to quantify who has been lucky and who unlucky, and it allows us to determine the specific skill at which a given player excels (or fails). We are able to separate the signal from the noise.

Because of all of the factors mentioned–the “noise”–there is a great deal of year-to-year variance in the actual results of a player’s performance. The overall trend is toward a late-20s peak followed by decline, but the number and rate of hits, home runs, doubles, etc. varies greatly from year to year. Advanced analytics develop different kinds of tools that “smooth” the jagged edges of the year-to-year variance by eliminating or accounting for more and more noise.

It is important to recognize that the “noise” itself has meaning. Poor performance is poor performance, even if it is not indicative of a player’s true talent level. A lucky win still goes in the W column. A player whose home run totals are inflated by Coors Field in Denver still has those home runs to his credit. When a batter faces a pitcher, he either will or won’t get on base. He either will or won’t strike out. This is what gives the game its drama: after all the analysis, the players must still go and play the game, whose outcome is far from certain. All advanced statistics can do is give a good idea of what to expect from a player–a better idea, in fact, than “traditional” statistics that count (noisy) results. They do not tell us what happened or predict with certainty what will happen, though they can predict what will happen with substantially better accuracy than traditional statistics. For instance, FIP predicts next year ERA better than ERA.

Can some of these insights be applied to the study of responsa? Certainly, although there is a certain tension here between the historian and the statistician. For the historian, each responsum is a discrete historical event to be studied on its own. To the extent that the “noise” is part of the event and can be determined, the historian wishes to do so. They are interested in what actually happened.

Statisticians, on the other hand, want to isolate performance from all but the most directly relevant factors. As long as the number of responsa that a given posek wrote in a year is somewhat consistent with expected year-to-year variance, it does not trouble them too much. Whatever may have inflated or depressed the number of responsa that year, even if it was not sheer luck, should be ignored when trying to determine the longer arc of the posek’s career, if the spike or dip is within the typical noise pattern. They want to see transition periods, when the posek breaks out (or in stages), if he declines at the end of his life due to health,  and other larger trends, not blips and aberrations. They’ll want this:

Hatam Sofer & EMAs
Hatam Sofer & EMAs

We’ll get in to more details soon. Stay tuned.

Ockham’s Razor and Hatam Sofer

Let’s start with a trivia question: Hatam Sofer (1762-1839) sent responsa to every single Jewish community (in existence at the time) in one modern-day country. What country is it?

Not long ago, I (Moshe) was in the backseat of my grandfather’s car, and we were schmoozing about HaMapah. I mentioned we were mapping the responsa of Hatam Sofer and his first question was: “and was he sent questions from all of Europe?”

We’ll get to that in a minute.

One of our central goals is to try to understand the halakhic world as it was perceived by people at the particular time, not as we presently interpret it. Today one might hear in the oylem that “Hatam Sofer sent teshuvot to all of Europe”. But is this assertion in fact, true?

Let’s try to refine the question a bit. Europe is a big place and Jews were only in some parts of it. Poskim only sent responsa to places with Jews, so “all of Europe” really means “every Jewish area in Europe.” So to answer the trivia question we opened with, Hatam Sofer sent teshuvot to the only two towns in Switzerland where Jews were allowed to live at the time.[1] Thus, trivial as it may sound, in Jewish terms, Hatam Sofer sent teshuvot to all of Switzerland.

But even on this relatively lenient standard, the prevailing assumptions are all wrong. Out of 675 responsa of Hatam Sofer for which we have place data, a grand total of three were sent anywhere within the vast Russian Empire. While it is possible that he in fact wrote several hundred teshuvot to Russia, and they were all chucked into a fire by some angry Hungarian muttering obscenities about Litvaks, this strikes me as incredibly improbable.[2] Ockham’s Razor tells us that we should dismiss the common belief. I also want to preempt an objection–“but look at how widely he’s quoted”–by noting that all of Hatam Sofer’s works were published posthumously.

Let us compare Hatam Sofer to the person with whom we would most intuitively associate him: his father-in-law and near exact contemporary–they were born within a year of each other and died within two–Rabbi Akiva Eger. Both established themselves far from where they were born but in German-speaking areas: Hatam Sofer was born in Frankfurt but established himself in Central Europe: first in Dresnitz (Strasnice, Czechia), then Mattersdorf (Mattersburg, Austria), and finally, for the last 30+ years of his life, in Pressburg (Bratislava, Slovakia). R. Akiva Eger, on the other hand, was born in Eisenstadt (Austria–very close to Mattersdorf; both are part of the Siebengemeinden, the “Sheva Kehilot” in Burgenland, or, in Elli’s preferred parlance, “the Seven Dorfs”). His rabbinic career took him north into Silesia and then to the territories that Prussia had recently sliced off of Poland. The last two decades of his life he was the rabbi of Posen (Poznan, Poland).

Today, they are considered transcendent figures. However, in their lifetimes, they were not transcendent. Consider this map of the two of them, and see for yourself what they did not transcend. (In a new tab)

(Hatam Sofer is blue, R. Akiva Eger is red)

The sorting effect is really dramatic–the choice between R. Akiva Eger and Hatam Sofer falls cleanly on Austrian vs. Prussian lines. The main outliers for both R. Akiva Eger and Hatam Sofer are one another. An inordinate number of responsa written by Hatam Sofer to Prussia were to R. Akiva Eger, and an inordinate number of responsa written by R. Akiva Eger to the Austrian Empire were to Hatam Sofer and his son, R. Avraham Shmuel Binyamin Sofer (Ktav Sofer).

Why does psak tend to stay within the same country? There’s no per se halakhic reason; the halakhic system and methodology, as generally laid out, should not assign any value to the Austria/Prussia border. However, how the system “should” work is ultimately not the point.

Halakhah, and I thank Russ Roberts and EconTalk for inspiring this point (Elli touched on some of this in our first post, but I prefer a different angle, specifically, less top-down and more bottom-up or agent driven, perhaps more Hayekian?) is a case of emergent order. Nobody designed our modern halakhic apparatus. Nobody assigned you to a specific posek, and no “posek ha-dor” was ever voted on and elected (at least not in the last millenium). It is an organic, spontaneous, informal system that arises from the decisions of independent agents. These independent agents might think that their posek should be a good Prussian, and there is little that can be done about it. A few generations later, different independent agents might decide that Hatam Sofer was the posek ha-dor of a generation when none of those agents were alive.

Today, any respectable beit midrash needs a Hiddushei Rabbi Akiva Eger and a Responsa Hatam Sofer, yet the converse is not true: Responsa Rabbi Akiva Eger and Hiddushei Hatam Sofer are not mainstays in the same way. No grand theory of halakhah can easily account for why their works should be so bifurcated in terms of importance. How is it that R. Shabbetai Cohen wrote arguably the most important commentary on Shulhan Arukh Yoreh De’ah, and an utterly forgotten book on Tur Yoreh Deah? This is emergent order created by the independent actions of independent agents.[3]

One last note: Hatam Sofer is interesting. Unlike almost everyone else we’ve done so far, who were usually “just” poskim, he was an influential pedagogue. His students express tremendous love for him, not just as a posek or a scholarly role model, but in a personal way, too. Our operative theory here is that his influence really begins to expand as his students take up positions around Hungary. This can be seen on a map of Hatam Sofer’s responsa as function of time:

(In a new tab)

[1] These are Ettlingen and Lengnau, which are actually only a couple kilometers apart; they even shared their cemetery.

[2] Though as a dependent probability, if an angry Hungarian did chuck them into a fire, it seems pretty probable that he was muttering obscenities about Litvaks.

[3] F.A. Hayek writes (Law, Legislation and Liberty, pp. 118-119):

“The judge, in other words, serves, or tries to maintain and improve, a going order which nobody has designed, an order that has formed itself without the knowledge and often against the will of authority, that extends beyond the range of deliberate organization on the part of anybody, and that is not based on the individuals doing anybody’s will, but on their expectations becoming mutually adjusted. The reason why the judge will be asked to intervene will be that the rules which secure such a matching of expectations are not always observed, or clear enough, or adequate to prevent conflicts even if observed. Since new situations in which the established rules are not adequate will constantly arise, the task of preventing conflict and enhancing the compatibility of actions by appropriately delimiting the range of permitted actions is of necessity a never-ending one, requiring not only the application of already established rules but also the formulation of new rules necessary for the preservation of the order of actions. In their endeavour to cope with new problems by the application of ‘principles’ which they have to distil from the ratio decidendi of earlier decisions, and so to develop these inchoate rules (which is what ‘principles’ are) that they will produce the desired effect in new situations, neither the judges nor the parties involved need to know anything about the nature of the resulting overall order, or about any ‘interest of society’ which they serve, beyond the fact that the rules are meant to assist the individuals in successfully forming expectations in a wide range of circumstances.”

I think every word here applies to halakhah, even more so than the original, given how the selection of the judge/posek is a case of spontaneous order in and of itself.

Introducing Binyan Zion (As seen in Ami Magazine!)

Readers who are also subscribers to Ami Magazine (and Ami Magazine readers who learned about us from Yossi Krausz’s awesome profile) know that we have mapped out Responsa Binyan Zion, by Rav Yaakov Ettlinger (1798-1871). R. Ettlinger gained prominence as rabbi of Altona, Germany, part of the famed triple community of AHU, along with Hamburg and Wandsbeck. This map gives us a look at a different region, a bit earlier in the 19th century.

For now, we want you to enjoy playing around with the map to see what you make of it. In a few days, Elli will post something about what we might be able to learn by plotting Binyan Tziyon geographically and by date, and I will analyze the similarity and dissimilarity of Binyan Zion to other poskim of the age. (For starters, look at Galicia on the maps below, and ponder what it means.) We’re mostly done with both Hatam Sofer and Maharam Schick, and we hope to post them both soon, once we’ve removed a few inaccuracies and filled in a couple of gaps.

The first map here is a heat map of Binyan Zion. You can enable Maharsham layers to compare if you want. I recommend viewing it in a separate tab, and viewing it on a computer will give you the best experience. Mouse over / click on cities for more info.

And to get ready for Elli’s post, here’s an animated view of the Binyan Zion (again, I recommend opening a separate tab). Note the bars at the bottom, which gives the number of responsa per year. Is that what you would expect a rabbinic career to look like? Either way, the date tools enable us to do some pretty cool things.

One final point: off to the right of the page there’s a box where you can enter your email address and automatically get an email when we post to the blog.

Zoom In

Last week we used the Maharsham to take a look at some large scale phenomena, especially cultural boundaries. Now we’re going to zoom in on some of the things we noticed that are going on within those boundaries.

One of the major questions we are trying to help answer with this project is whether rabbinic authority can be quantified. Can we use metrics to give a sense of how important Maharsham is? And if so, how?

We have already looked at number of responsa and geographical spread. Those are important data. But are all responsa created equal? If a gabbai asks a rav whether the congregation should skip tachanun on Erev Tu BiShvat, and the rav sits down and writes a lengthy treatise in response, does it really tell us anything about his authority? There are certain types of questions that demonstrate real influence. If people carry on Shabbat based on an eruv approved by a particular rabbi, over and against competitors, it indicates authority. The higher the stakes, and the more lives the question affects, the more important the responsum, and the more authority demonstrated by the responding rabbi.

Let’s take a more concrete example. Through volume 8 of Igrot Moshe, there are 1805 published responsa of Rabbi Moshe Feinstein (RMF). Of those, 48 are written to Rabbi Yaakov Kantrowitz (h/t Michael Pitkowsky). R. Kantrowitz was hardly submitting to RMF’s authority, as he was at least 20 years older than him. Moreover, almost all of these responsa are what we might call “recreational”. These are not responses to halakhic questions, but long letters written by a severely underemployed rabbi in the early years of the Soviet Union (there is not much for a rabbi to do when religion is effectively banned). These 48 responsa to not evince much rabbinic authority.

As for spread, RMF’s responsa are very clustered. He runs up his score in particular cities and with particular people–about 90 are to Memphis (mainly to Rabbi Ephraim Greenblatt), for instance, or 5% of the total (we’re still working on quantifying how many to NYC, and whether to count different boroughs as different cities, but we will get there).

Note just how many questions the top few generate – there are 318 by the top ten alone.
Top questioners in Igros Moshe. [Click to enlarge.] Note just how many questions the top few generate – there are 318 by the top ten alone.
Now let’s go back to Maharsham. Of more than 1600 responsa, very few are “recreational.” They are all based on real, practical questions. Moreover, the top destination is Krakow, which received 29. In total, he wrote to 437 different places (out of the 1427 addresses we’ve identified). That is simply a mind-boggling number. And no more than 2% of his responsa come from any one place or person, except perhaps for his hometown of Berezhany. Nothing like RMF’s 5% to Memphis.

The point of this exercise is not to minimize the greatness of RMF. Rather, it is to show what a big deal Maharsham was, and he was a Big Deal. This has largely been forgotten over the course of a century of Lithuanian supremacism. Hundreds of community rabbis from hundreds of communities asked him their questions. His influence in his time and place was massive. There’s even a book called Maharsham: The Last Posek.

Yet for all his influence, there are certain places that his authority simply did not penetrate.

Drohobych was a huge Galician community in Maharsham’s later years. In 1910 it had over 15,000 Jews. Yet Maharsham addressed not a single responsum there. It’s not due to a regional lack of influence–he has 19 responsa to Stryi, which is less than 20 miles away and two-thirds the size. Another glaring hole is Przemyśl (Pshemyshl in Yiddish; vowels are overrated). Przemyśl’s Jewish population was slightly larger than Drohobych’s. Again, there’s no broader regional absence, as many nearby villages and towns have responsa addressed there, yet the big city is missing.

A final example: On the eve of WWI, the community of Sighet numbered c. 8,000 Jews–a sizable community–while nearby Bychkiv had just over 1,000. Yet only 5 responsa were addressed to Sighet, while seventeen were addressed to Bychkiv. In contrast to the other examples, Bychkiv is punching well above its weight.

We can posit explanations for the three cities with low (or nonexistent) numbers. Przemyśl was the seat of Rabbi Yitzchak Schmelkes, author of Beit Yitzhak and probably Maharsham’s main rival in Galicia in the generation after R. Yosef Shaul Natansohn. He was rabbi of Przemyśl for a long time, whereupon he was succeeded by his nephew and disciple. So Przemyśl remained under his “jurisdiction”, so to speak, even after his departure to Lviv.

As for Drohobych, we note that Rabbi Yitzhak Leib Sofer (1848-1907) was the city’s rabbi, and he had other influences: he was the son of Rabbi Avraham Shmuel Binyamin Sofer (Ktav Sofer) and thus a scion of the greatest rabbinic family in Western Hungary. If anything, his presence in Drohobych indicates that the Sofer family’s sphere of influence was expanding into Galicia.

As for Sighet, by this time its rabbinate was firmly controlled by the Teitelbaum family.

To understand what’s going on here, we borrow a concept from astronomy. The International Astronomical Union (IAU) defines a planet as: “a celestial body that (a) is in orbit around the Sun, (b) has sufficient mass for its self-gravity to overcome rigid body forces so that it assumes a hydrostatic equilibrium (nearly round) shape, and (c) has cleared the neighbourhood around its orbit.”[1]

A major posek like Maharsham exerts a massive gravitational pull on the entire region. He vacuumed up the questions from hundreds of towns and villages in Galicia. However, there were a few cities whose rabbis “cleared the neighborhood”. They remained the dominant gravitational force in those cities. It seems that there were cultural institutions–like a family rabbinate, for example–that were able to resist outside influence, or individuals with enough authority. In turn, Galicia’s cultural identity and rabbinic tradition is powerful enough to clear its neighborhood and monopolize questions from within its territory, in contrast to regions like Volhynia and Podolia, which send a large chunk of their questions to Galicia. Another example of a city that cleared its neighborhood might be Prague, which seems to have sent very few questions elsewhere over an extended period of time.[2]

These observations are tentative. We need a lot more research before we have anything conclusive, but we would not have even known to ask the question without the data. And we think it holds promise.

For now, think of this post as a study aid and as a way to quantify (and appreciate) rabbinic authority. We will tweak the methodology as we have more data to work with and as we are able to use more advanced metrics and software. This is really just the beginning.

That, in turn, brings us back to a feisty little Carpathian town that punches above its weight: Bychkiv, to which we will return in the next post.

[1] For those wondering at home, Pluto lost planethood over (c).

[2] Expect more on this later, but, in short, we’ve come near completion on a few more poskim, starting from 1800 or so, and we’ve seen virtually nothing to Prague and fairly little to Czechia as a whole.

Once a Galitzianer…

This divide also corresponds to the political division between the Kingdom of Poland and the Duchy of Lithuania, and we see that the cultural divide persisted even after the political boundary became defunct. However, Gertner surmised that the Jews of different empires would converge internally and diverge from one another as time went on, thus reshaping these cultural borders. Galician Jews would develop stronger affinities with Austrian, Hungarian, and Moravian Jews, while ties with Volhynia and Podolia would be weakened, and so forth.

Heat map of R. Shlomo Kluger's responsa, from Haim Gertner's thesis

A better way of visualizing this is to plot the Maharsham data onto a map of Europe’s year 1700 political borders. 1072 (74%) were sent to areas within the Kingdom of Poland, against 18 (1%) to the Duchy of Lithuania. The internal division of a confederation that had ceased to exist a hundred years before Maharsham’s responsa-writing prime is the most salient border in his sphere of influence.

Maharsham’s responsa overlaid on European internal borders in 1700

Returning to the Maharsham heat map, we can break things down more precisely. 790, or 55%, of his responsa were to Galicia. Looking at the dots of individual cities, we see that the responsa were evenly distributed throughout Galicia, more or less. Elsewhere in the Polish Jewish sphere of influence, there are 134 responsa addressed to Congress Poland (9%), and 227 to the eastern Ukrainian regions (16%; this includes the 13 responsa to Kherson, which were all to Odessa, and the 41 sent to Bukovina). Moreover, to the extent that Maharsham’s influence expanded beyond Galicia to the south and west, it was to regions that were very close to Galicia and to which Galician Jews were migrating in significant numbers, especially Northern Moldavia (37), Maramaros (78), and Transcarpathia (27). An additional 10% of his responsa went to these regions. That brings us to 90% of his responsa.

In all, there is a slight shift to the south and west in comparison with RSK. RSK wrote more responsa, both proportionally and in terms of raw numbers, to Volhynia, Podolia, and Kiev than Maharsham did, and most of the responsa that Maharsham sent into Russia were to places relatively close to the border with Austria. On the other hand, Maharsham had more of an influence in Hungary, especially those regions of Unterland that were near Galicia. One can even see that there were a number of communities between Budapest and Galicia–Eger, Mad, and Bodrogkeresztúr (Kerestir), to name a few–that sent their questions to Maharsham (2% of the total). The overall picture is one of striking similarity with a slight tilt away from the Ukrainian interior and toward Eastern Hungary.

Next post will delve a bit deeper into the data and look at some individual cities. For those who want to play along at home, look at Sighet, Przemysl, Cluj, Drohobych, and a town that readers will be becoming familiar with: Bychkiv.

[1] H. Gertner, “Gevulot ha-Hashpa’ah shel Rabbanut Galitzya be-Mahatzit ha-Rishonah shel ha-Me’ah ha-Tesha Estrei: R. Shlomo Kluger ke-Mikreh Mivhan” (“The Sphere of Influence of the Galician Rabbinate in the First Half of the Nineteenth Century: Rabbi Shlomo Kluger as a Test Case”), MA thesis, Hebrew University of Jerusalem, 1996. We thank Prof. Shaul Stampfer for referring us to this work.

[2] There are two maps of the Yiddish dialects out there. We like this one because it shows that Oberland (Western Hungary) transitioned from Western to Mideastern Yiddish, and we like this one because it’s demarcation of the border between Litvish and Southeastern Yiddish is more detailed and precise.

[3] Note that the line drawn on the map associated with this article does not correspond, in any meaningful way, to the actual dividing line between sweet and savory gefilte fish.

css.php
Verified by ExactMetrics