Measuring the Geographic Similarity of Poskim*

There’s a phrase that people like to quote, “labels are for cans”. While the statement’s intentions — either “stereotyping is bad” or “I’m a special snowflake”–are good and relatively inoffensive, respectively, it makes for bad epistemology. It’s a terrible approach to organizing information.

To understand, we need to generalize. To understand the course of any field, we need a broader understanding, a concept of a movement or a style. Sometimes, this division can take on an objective aspect. At an extreme, an artistic group like the Pre-Raphaelite Brotherhood or the Wu-Tang Clan has a defined set of artists who comprise it. However, even that can quickly break down. Ford Madox Brown is stylistically part of the Pre-Raphaelite Brotherhood, he hung out with them a lot, and his work is displayed with theirs, but he was never a member. Broader characteristics run into issues like this too. Kanye West may be from the Midwest, but to the accepted meaning of a “Midwest Rap” style, as exemplified by Twista, Tech N9ne, Krizz Kaliko, Royce Da 5’9”, or Eminem, an emphasis on technical mastery, speed, and precision, with a smattering of themes from horrorcore, he’s certainly not that.

So when I try and discuss data-informed categorization, it’s important to clear up my intent up front. In terms of intellectual categories, I’m not trying to remove subjective judgements. I’m trying to inform. The goal here is to present another variable that can be incorporated into a broader stylistic judgement. The actual measured effect of a posek in terms of area of direct influence, implied or otherwise, should certainly factor into any intellectual taxonomy, and certainly ought to dominate a taxonomy of the landscape.

Our maps have their limits. When we have areas of influence that are completely disjunct, it’s trivial to draw the appropriate conclusions with the eyeball test. However, what to do with somewhat overlapping sets of a couple hundred points each? How do we meaningfully assess the relative similarities of multiple sets of a few hundred points of different sizes, all weaving in and out of each other?That’s where the math comes in.

Our basic metric is cosine similarity. For readers who don’t remember much about sines and cosines, here’s a little refresher. The cosine of 0 is 1, and the cosine of 90 degrees is 0. The more acute an angle, the closer it gets to 1.

Now, let’s imagine two poskim. Posek A writes responsa only to Minsk, and Posek B writes responsa only to Pinsk. Imagine that we plot this on a two-dimensional grid, with the X-axis representing responsa to Minsk, and the Y-axis representing responsa to Pinsk. Each posek can then be expressed as a point in the grid: Posek A as (M, 0) and Posek B as (0, P), because Posek A writes 0 responsa to Pinsk, and Posek B writes 0 to Minsk. That is, Posek A is expressed as a point on the Minsk axis, and Posek B as a point on the Pinsk axis. We can then think of our poskim as line segments, or “vectors”, from the origin to the grid coordinate. It’s obvious that the two vectors in our case are orthogonal. They form a right angle, and thus have a cosine of 0. This means that they are perfectly dissimilar; they have no places in common.

Now imagine Posek C who also writes only to Minsk. Her vector will form an angle of 0 degrees with Posek A’s vector, so they will have a similarity score of 1, which is the cosine of 0.

This exercise is meant to show how the cosine of two vectors provides a good metric for scoring similarity. It’s not perfect, but it’s good.

Two dimensional space is pretty easy to envision, but dealing with 500 place names requires a 500-dimensional vector space, which is impossible to envision. Fortunately, thanks to math, we don’t need to envision it. And since there cannot be any negative numbers (because it’s impossible to send a subzero number of responsa to a place), the angle between the vectors will always be between 0 and 90. We can compare any two poskim to obtain a similarity score between 0 and 1.

Let’s walk through the basic process again with vectors in 4 dimensions. We start with the data from two poskim.

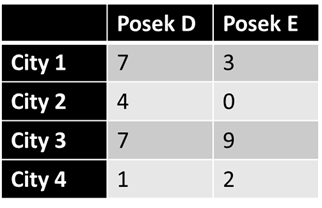
So this table will become two vectors, for Posek D [7 4 7 1] and for Posek E [3 0 9 2]. The order of the cities doesn’t matter, provided that they are respective — that the nth place in each refers to the same place. We then take the angle between the two vectors. In this case, the angle is about 34.2 degrees, and the cosine of the angle is 0.827.[1] Since the cosine goes from 0 to 1, the similarity between the poskim is high. This passes the eyeball test, too; there is no city to which E writes that D does not write to, and only one that D writes to but not E. This is a lot more similar than we’d expect in reality. As we have seen, the career of a posek is dynamic; they move, and their sphere of authority grows and shrinks and shifts over time, and communities likewise change. When we divide a posek’s career in half chronologically[2] and compare the first half to the second, the cosine tends to be in about the 0.35-0.5 range (typically around 0.4). Therefore, when two poskim score 0.3 or above, it means they are very similar in terms of geographical reach. A score above 0.4 means that the geographic reach of the two poskim are as similar as two halves of the career of a single posek, or about as similar as can reasonably be expected.

We can formulate another version of this, where we turn the vectors into binary vectors — D now gets [1 1 1 1] and E [1 0 1 1], the effect here being to just ask about where, without regard to distribution. We call this “unweighted”. We use a third type here — “mixed” — a simple average of the two. Crucially, the size of the vector — the distance from the origin — doesn’t impact the angle, so we can measure between people with very different corpus sizes.

What can we get from this? For starters, can we justify traditional divisions? Let’s take a look.

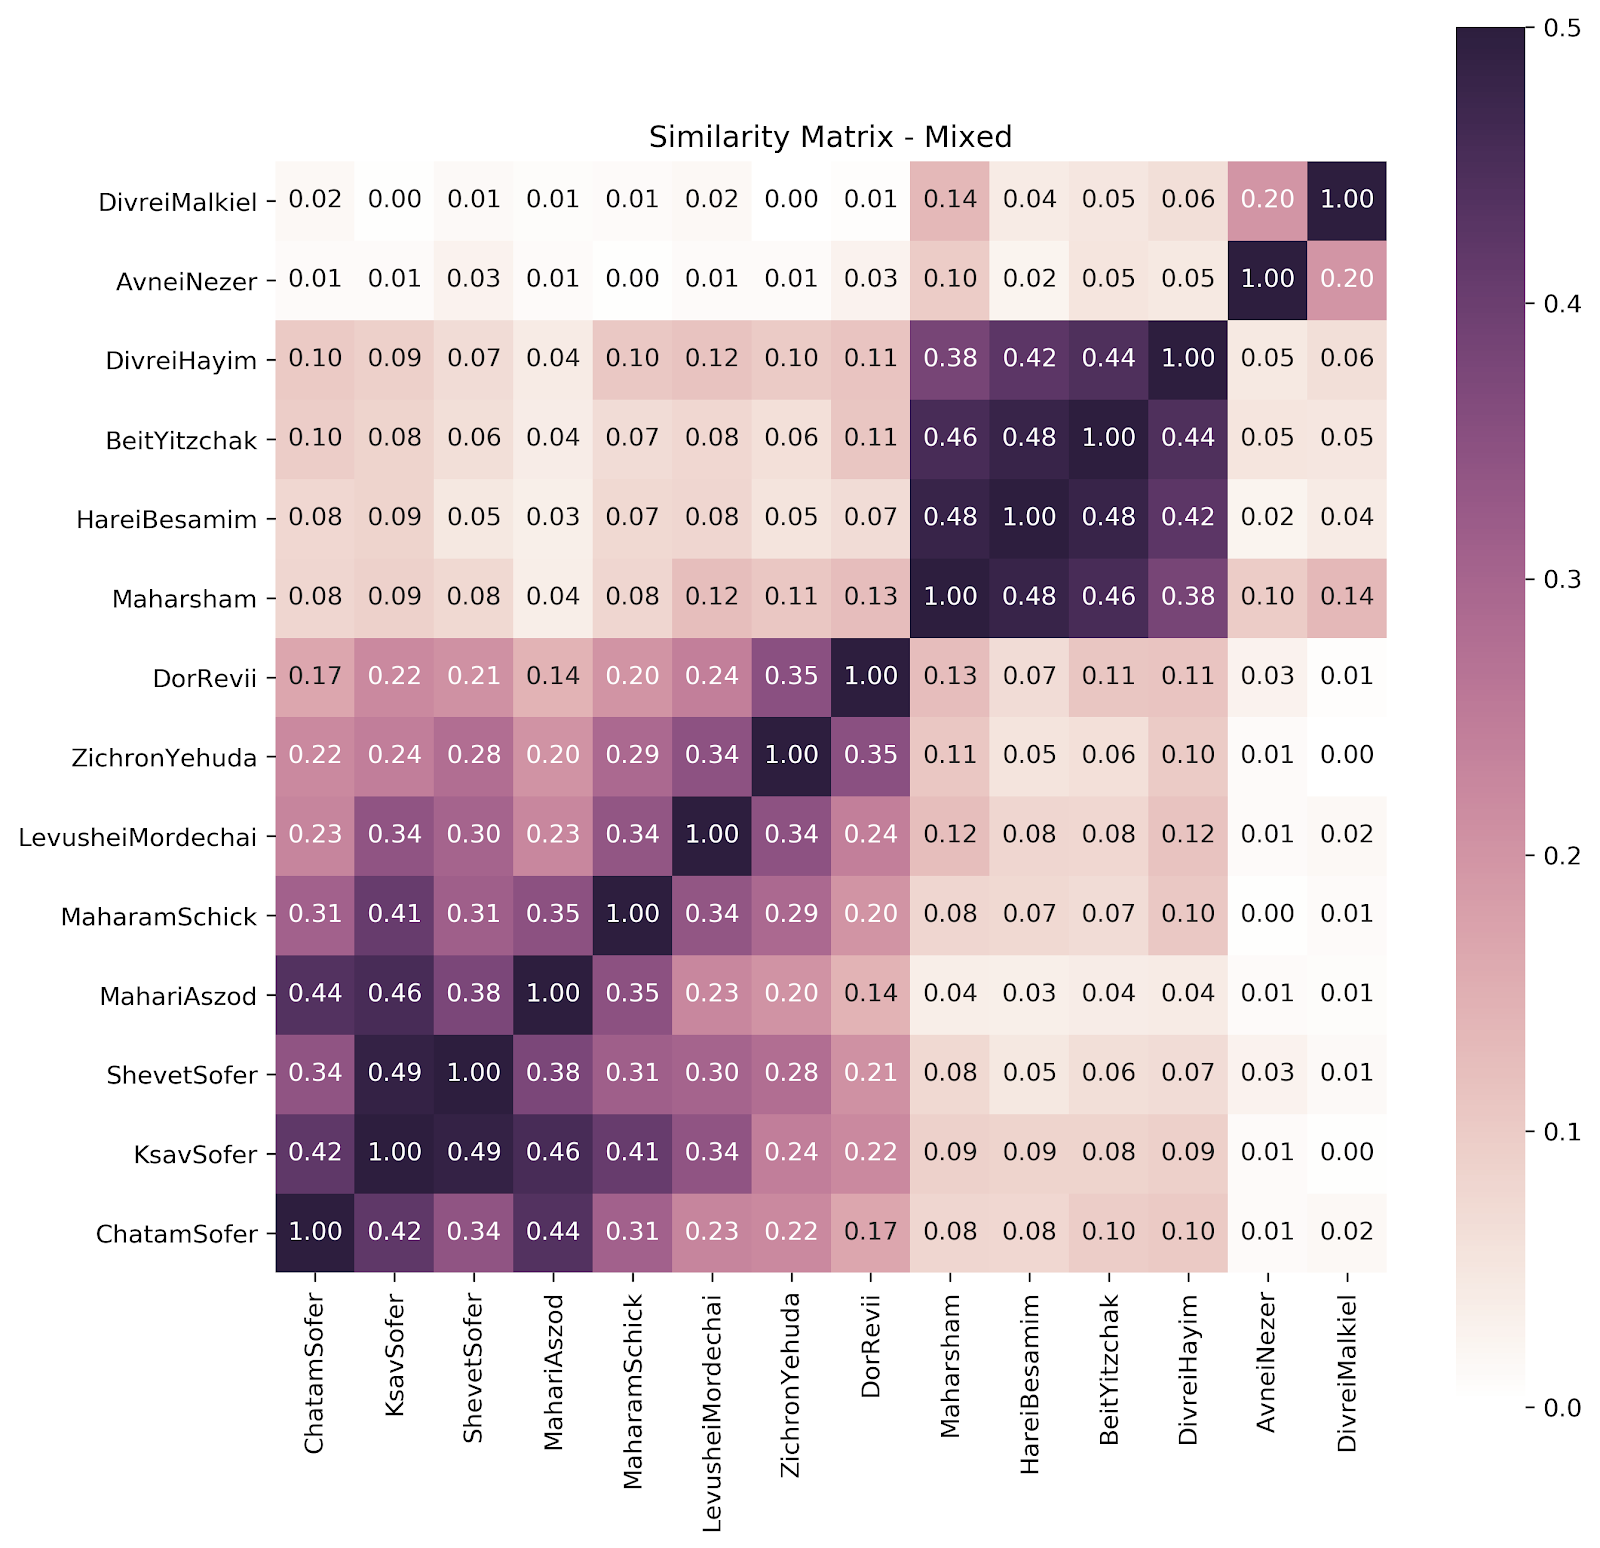
We can see a pretty clear division here — with Hungarians and Galicianers following the expected division, and a showing for our Poles (Avnei Nezer and Divrei Malkiel) of “close but no cigar”. (Divrei Malkiel was the Rav of Łomża, close to Lithuania; some may protest his being lumped with the Poles.) Let’s drop them for now.

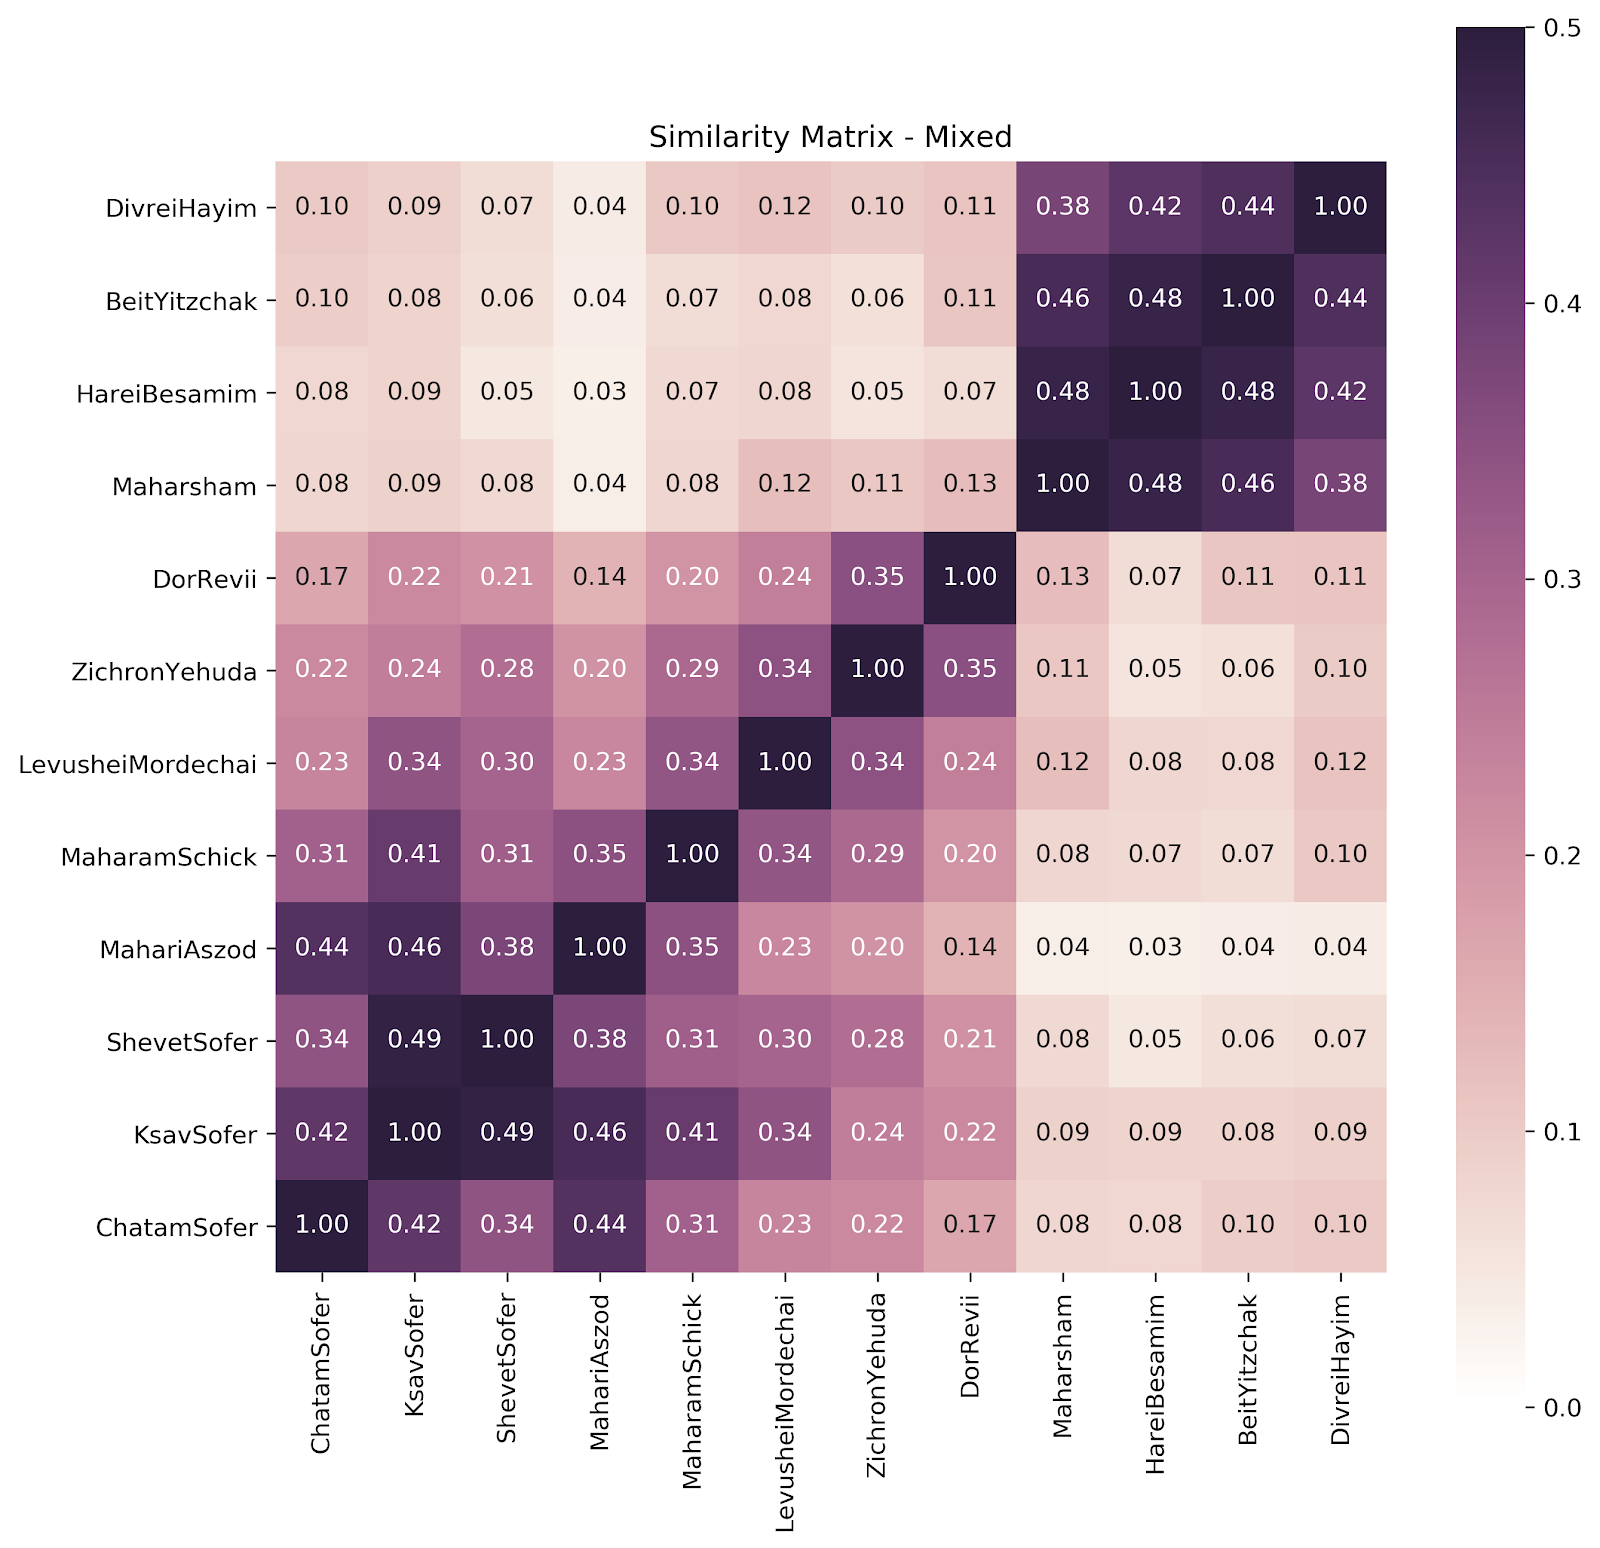
So we see a really clear division between the Hungarian and the Galicianers. The Galicianers are all quite similar to each other, and all mostly dissimilar to the Hungarians. But there’s another thing going here too. Let’s take a look at just the Hungarians. And we’ll rearrange it here.

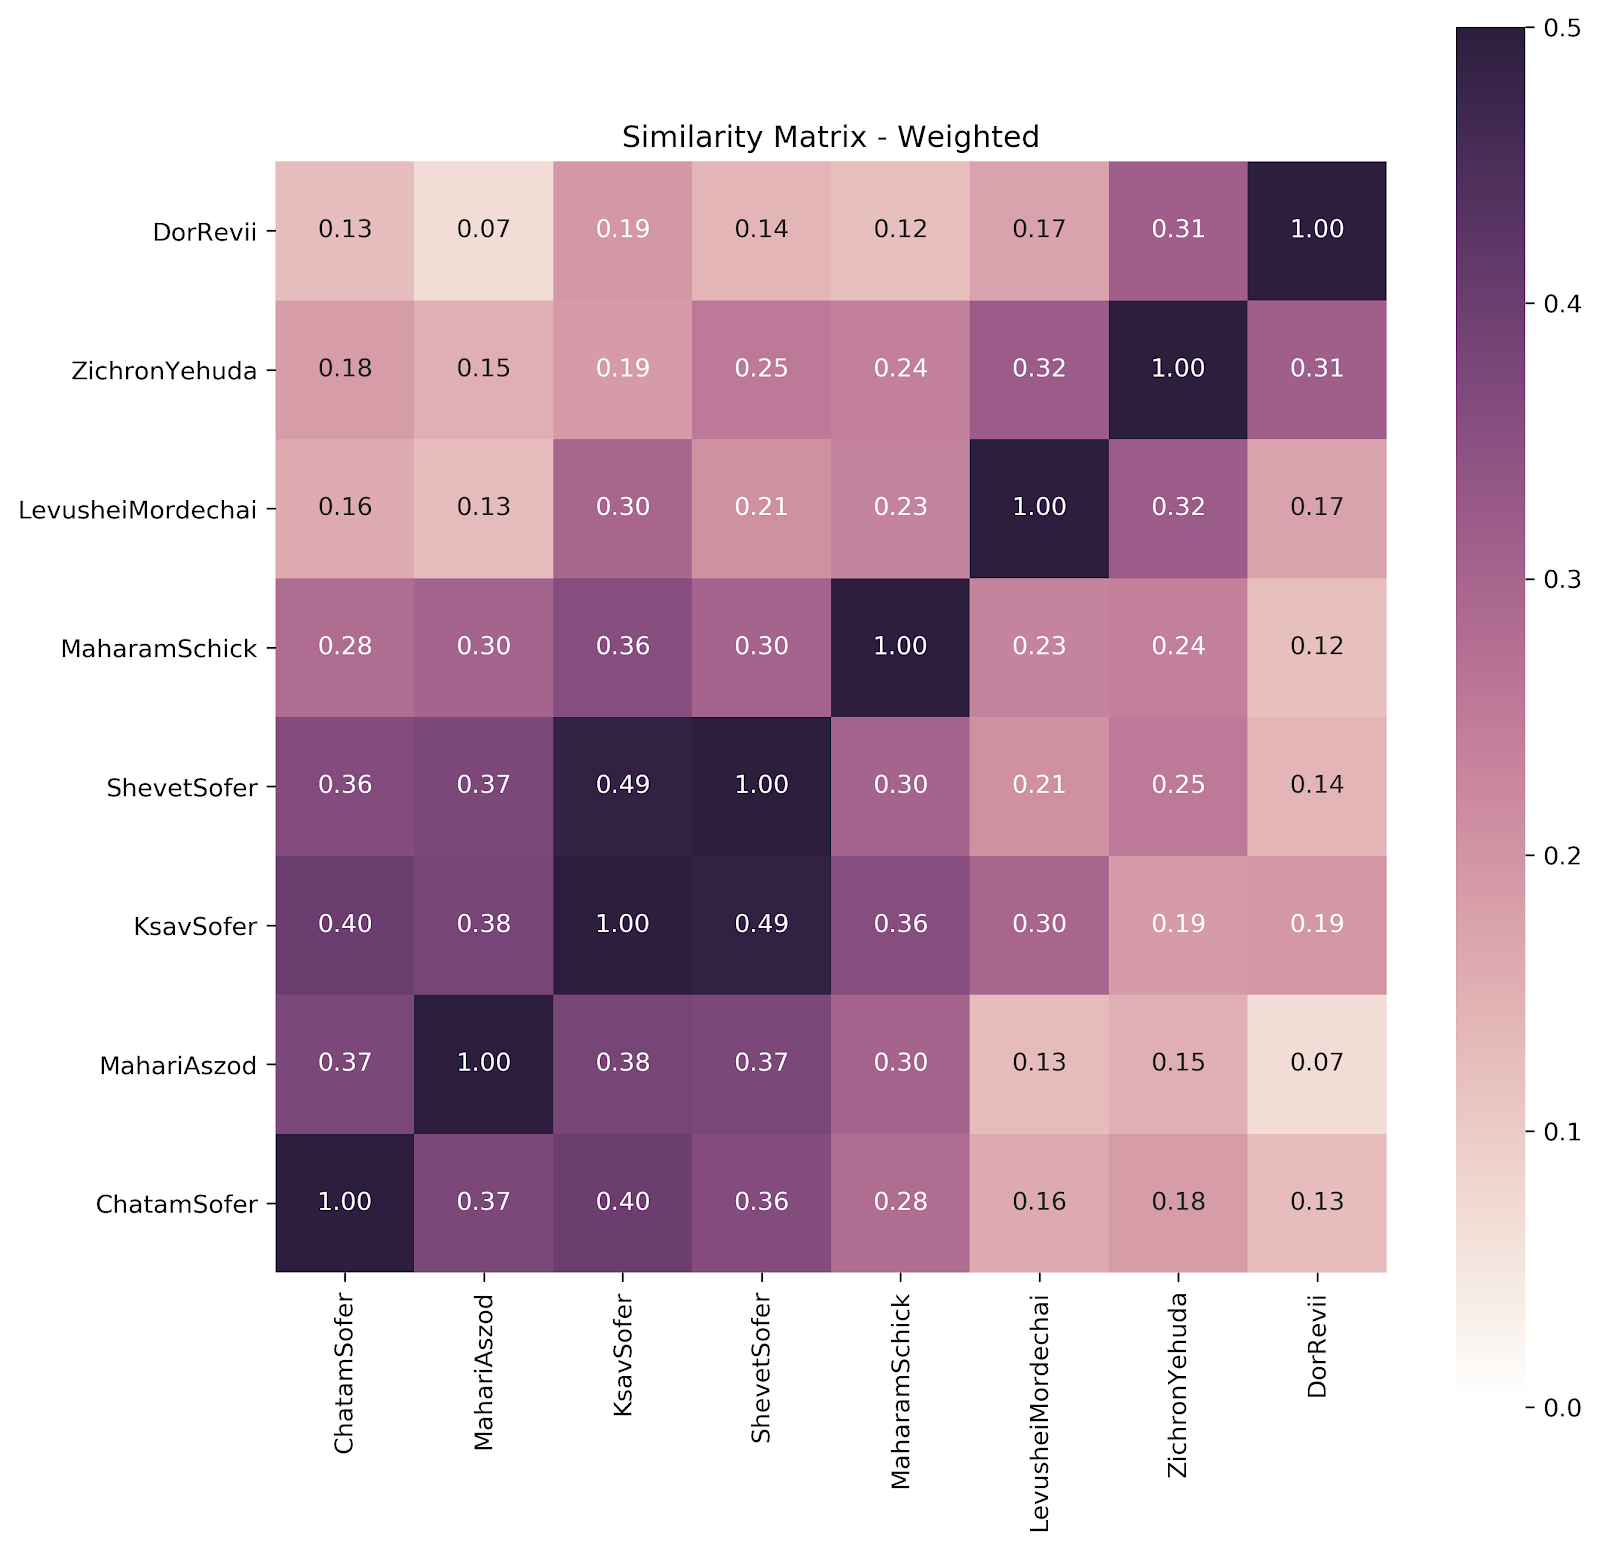
We can tease out a couple more things here. We can see the Sofer family — Oberland cluster clearly; the Maharam Schick (who moved from Oberland to Unterland mid-career);belongs there too, but a little less; the two most Unterland Unterlanders pair nicely, and the Levushei Mordechai (who also moved) straddles the two.

Further data would be nice (and we’re working on it), but what we have thus far suggests that we can view Hungarians as a distinct species, as it were, with Unterland and Oberland subspecies (and those who straddle both).

I’ll add another point — preliminary results thus far delineate that Hasidic psak is a subgroup within regions. Hasidic poskim do not command broad loyalty beyond their region. This may also well be the case beyond just the geographical spread data, in terms of methodology and style as well; for one example that comes to mind immediately, we hypothesize that Chabad’s tendency to rule strictly about eruvin is linked with their being a Hasidic subset of Lithuanians, not a Lithuanian subset of Hasidim.

[*] Thank you to R. Dan Margulies, who hashed out the math here with me (Moshe).

[1] In reality, we don’t ever take the actual angle, we calculate it as dot(u,v)/(norm(u)*norm(v)).

[2] Meaningful divisions here are less similar than random divisions. People die, people move, and various other events mean that we see a grouping that is “lumpy” — dividing a corpus chronologically does not approximate an even division. In a random division, any discrepancy between the similarity and 1 would be pure noise. Here, there are signals going on too.

Mountains of Spices

We haven’t been posting, but we’ve been busy. We have updated some of the earlier maps with improved data and better identifications. We also have some shiny new toys to share.

First up is Harei Besamim, by Rabbi Aryeh Leib Horowitz (1847-1909), a contemporary and “competitor” of Maharsham in Galicia. During his career, he served terms as the rabbi of Seret, Stryi, and Stanislav (I’ll take “Galician Cities that Start with ‘S’” for $500, Alex). (Yes, we are aware that Seret is in Bukovina, that Stanislav is now called Ivano-Frankivsk, and that he was also the rabbi of Zaliztsi early in his career.)

We have a map (click here) and a plot by year. The plot by year is fairly unremarkable; it’s in line with most of what we’ve seen before, a rise in his earlier career followed by a plateau, with a typically high degree of noise.

Responsa by year

He is not very well-known today; he doesn’t even have a Wikipedia page. But he wrote over 600 responsa, to over 200 communities. His correspondents included major rabbinic and Hasidic figures. And he also provides some excellent contrast data to Maharsham. We haven’t formulated any hypotheses about what this means, but the data is good, and our mission is to provide good data. As for an explanation, tzarich iyun, or rather, tzarich data. Maybe once we map Beit Yitzchak and Sho’el U-meshiv, or digitize the census of Galicia from 1900, things will be clearer.

Look out for Moshe’s upcoming post on the Seforim Blog (Sunday) on whether data analysis can tell us whether the late volumes of Igrot Moshe are forgeries.

Once a Galitzianer…

This divide also corresponds to the political division between the Kingdom of Poland and the Duchy of Lithuania, and we see that the cultural divide persisted even after the political boundary became defunct. However, Gertner surmised that the Jews of different empires would converge internally and diverge from one another as time went on, thus reshaping these cultural borders. Galician Jews would develop stronger affinities with Austrian, Hungarian, and Moravian Jews, while ties with Volhynia and Podolia would be weakened, and so forth.

Heat map of R. Shlomo Kluger's responsa, from Haim Gertner's thesis

A better way of visualizing this is to plot the Maharsham data onto a map of Europe’s year 1700 political borders. 1072 (74%) were sent to areas within the Kingdom of Poland, against 18 (1%) to the Duchy of Lithuania. The internal division of a confederation that had ceased to exist a hundred years before Maharsham’s responsa-writing prime is the most salient border in his sphere of influence.

Maharsham’s responsa overlaid on European internal borders in 1700

Returning to the Maharsham heat map, we can break things down more precisely. 790, or 55%, of his responsa were to Galicia. Looking at the dots of individual cities, we see that the responsa were evenly distributed throughout Galicia, more or less. Elsewhere in the Polish Jewish sphere of influence, there are 134 responsa addressed to Congress Poland (9%), and 227 to the eastern Ukrainian regions (16%; this includes the 13 responsa to Kherson, which were all to Odessa, and the 41 sent to Bukovina). Moreover, to the extent that Maharsham’s influence expanded beyond Galicia to the south and west, it was to regions that were very close to Galicia and to which Galician Jews were migrating in significant numbers, especially Northern Moldavia (37), Maramaros (78), and Transcarpathia (27). An additional 10% of his responsa went to these regions. That brings us to 90% of his responsa.

In all, there is a slight shift to the south and west in comparison with RSK. RSK wrote more responsa, both proportionally and in terms of raw numbers, to Volhynia, Podolia, and Kiev than Maharsham did, and most of the responsa that Maharsham sent into Russia were to places relatively close to the border with Austria. On the other hand, Maharsham had more of an influence in Hungary, especially those regions of Unterland that were near Galicia. One can even see that there were a number of communities between Budapest and Galicia–Eger, Mad, and Bodrogkeresztúr (Kerestir), to name a few–that sent their questions to Maharsham (2% of the total). The overall picture is one of striking similarity with a slight tilt away from the Ukrainian interior and toward Eastern Hungary.

Next post will delve a bit deeper into the data and look at some individual cities. For those who want to play along at home, look at Sighet, Przemysl, Cluj, Drohobych, and a town that readers will be becoming familiar with: Bychkiv.

[1] H. Gertner, “Gevulot ha-Hashpa’ah shel Rabbanut Galitzya be-Mahatzit ha-Rishonah shel ha-Me’ah ha-Tesha Estrei: R. Shlomo Kluger ke-Mikreh Mivhan” (“The Sphere of Influence of the Galician Rabbinate in the First Half of the Nineteenth Century: Rabbi Shlomo Kluger as a Test Case”), MA thesis, Hebrew University of Jerusalem, 1996. We thank Prof. Shaul Stampfer for referring us to this work.

[2] There are two maps of the Yiddish dialects out there. We like this one because it shows that Oberland (Western Hungary) transitioned from Western to Mideastern Yiddish, and we like this one because it’s demarcation of the border between Litvish and Southeastern Yiddish is more detailed and precise.

[3] Note that the line drawn on the map associated with this article does not correspond, in any meaningful way, to the actual dividing line between sweet and savory gefilte fish.

Rabbinics, meet Analytics

A true responsum, the answer that a rabbi writes to a query posed by another rabbi, is the basic unit of rabbinic authority. It orders the two correspondents hierarchically; the one asking acknowledges the greater expertise of the one answering, thereby expanding the latter’s influence. Moreover, because the hierarchy is, as Jacob Katz wrote, “unofficial” and “spontaneous,” emerging implicitly from the deference of the secondary and tertiary elite, it can tell us more about the dynamics of influence, reputation, and expertise than many other forms of legal authority.

Words like “authority” and “influence” are used, in this context, in contradistinction to “power.” If a rabbi was heeded, certainly by a distant correspondent, it was because the interlocutor voluntarily submitted to the rabbi’s decision. Aside from certain limited local powers, largely dependent on the approval of the lay leadership, there was no mechanism by which a rabbi could enforce his decisions. As Salo Baron wrote, this places rabbis in the “awkward position of theoretical supremacy and actual inferiority.”

On the other hand, since rabbinic authority is not dependent on enforcement, it can cross borders without encroaching on the sovereignty of any state. This does not mean that there are no borders or boundaries; there often are. However, the boundaries of cultural territories are sometimes more pronounced and significant than political borders. For instance, the old frontier between the Kingdom of Poland and the Duchy of Lithuania was still significant in the early 20th century – more significant, perhaps, than the border between the Austro-Hungarian Empire and Russia or Romania.

These insights lie at the heart of HaMapah and its objectives. The “metadata” of responsa – When they were written, to whom, by whom, to where, etc. – can be quantified, plotted on a map, and visualized in different ways – akin to the “Mapping the Republic of Letters” project at Stanford. Given enough data, we can examine the effects of national and cultural borders on the spread of rabbinic authority; the effects of transportation and communication systems and technologies; we could compare the “reach” of halakhists who lived near one another, either at the same time or in succession; we could look at the dynamics of succession, when one authority passed away and another took his place; we could precisely plot out the growth of rabbi’s authority – whether it spreads gradually or abruptly, in all directions or in particular directions. There are new questions that did not even dawn on us until we started looking at the graphic representations, the maps and charts.

Eventually we want to get into some even deeper stuff, like the sources quoted by responsa in different ways (as support, to disagree; by name and anonymously; rabbinic sources and non-rabbinic, halakhic and non-halakhic, and so forth). We’d also like to map other corpora, like approbations and subscriber lists (“prenumeranten”). We’re on the cusp of something new, big, and exciting.

Initially, we are going to focus on the “long” 19th century – roughly from the First Partition of Poland in 1772 through the First World War. The first responsa we analyzed and mapped are those of Rabbi Shalom Mordechai Schwadron of Berezhany (Maharsham, 1835-1911), a leading Galician halakhist in the generation prior to World War I – that is, when Galicia was still part of the Habsburg Empire, before it was integrated into the reconstituted Poland after the war.

So without further ado, here is a heat map of “Maharsham Land”.

Each shaded region is a province that existed in 1900. The thick black lines are international boundaries. The darkest region is Galicia itself.

Here’s another visualization of the data.

Each dot is a community to which Maharsham addressed a responsum; the larger the dot, the more responsa he addressed to the community (you can open the map separately too).

These maps tell us a great deal, but before we get to that, we’d love to hear from readers about what leaps out at them, what grabs their attention. We will share some of our own insights in the next post. We hope to post fairly regularly, so follow us here and on Facebook.

css.php
Verified by ExactMetrics